
Monitor IronWorker Tasks with Prometheus!
Imagine being a developer, unaware of the teeming activity within your worker systems, making it impossible to detect issues before they become full-blown problems. Sound familiar? To combat this, we're introducing our latest feature – the ability to monitor IronWorker tasks with Prometheus. In this post, we'll guide you through setting up Prometheus with IronWorker, unlocking real-time analytics, and enhanced monitoring capabilities for your applications.
Table of Contents:
- What is Prometheus?
- What is IronWorker?
- FAQs on Prometheus and IronWorker integration.
- Example Use Case: Optimizing Healthcare Device Data Processing
- Monitoring IronWorker Metrics with Prometheus
- IronWorker task’s workflow
- IronWorker endpoint for Prometheus
- Configure Prometheus to run locally
- Conclusion
Before getting into the integration process, let’s take a look at what is Prometheus and how exactly it can help monitor IronWorker tasks.
What is Prometheus?
Prometheus is a systems and service monitoring system. It collects metrics from configured targets at given intervals, evaluates rule expressions, displays the results, and can trigger alerts if some condition is observed to be true. Visit prometheus.io for the full documentation, examples, and guides.
Prometheus Official Documentation
What is IronWorker?
IronWorker is a massively parallel multi-language worker platform. From crawling the web to delivering notifications at scale, it allows one to run thousands of tasks in parallel and schedule jobs easily from within the applications.
IronWorker Official Documentation
FAQs on Prometheus and IronWorker Integration
- Can Prometheus monitor multiple IronWorker projects? Yes, Prometheus can easily monitor multiple IronWorker projects, providing comprehensive visibility across all your tasks.
- How secure is the data transmitted between Prometheus and IronWorker? Prometheus supports secure communication protocols, and data transmission can be made secure through encryption and secure channels.
- Can I receive alerts from Prometheus on my mobile device? Yes, with proper configuration and the use of appropriate alerting tools like Alertmanager, Prometheus can send alerts to your mobile device.
- How can I add custom metrics from my IronWorker tasks to Prometheus? You cannot configure the IronWorker metrics endpoint to return custom metrics but you can make a feature request. You can also push the data to Prometheus from the IronWorker tasks code (read here).
- How can I backup the data collected by Prometheus from IronWorker? Prometheus has built-in support for backups. You can also use external storage systems supported by Prometheus for backing up data.
Example Use Case: Optimizing Healthcare Device Data Processing
A multinational company, recognized for its healthcare devices, utilizes IronWorker to manage data from its worldwide connected devices. As the firm expands, it faces processing delays, especially during peak times, impacting report generation and anomaly detection.
Implementing Prometheus with IronWorker allows the company to monitor real-time task statistics, identify processing bottlenecks, and optimize task distribution. Prometheus' alerting feature enables swift identification of processing issues.
This integration results in efficient workflow management, prompt anomaly detection, reliable reporting, and improved patient care.
Now that we have a fair idea of the monitoring capabilities of the Premotheus-IronWorker integration, let’s look at the integration process.
Monitoring IronWorker Metrics with Prometheus
IronWorker task’s workflow
When you push a new task to IronWorker, it puts it into the queue and sets its state to “queued”. The runner is the “agent” that permanently polls this queue, retrieves the task, and runs it. When the runner starts processing the task - it changes the status to “preparing”. At this stage, the runner pulls the docker image and other stuff it needs to run the task. After the preparation step is done - the state is changed from “preparing” to “running” and the runner starts running the code of this task. Depending on the result, the final status can be:
- “complete” (task completed successfully)
- “error” (the task failed, due to an exception in the code for example)
- “timeout” (task’s duration exceeded the timeout limit)
- “canceled” (user manually canceled the task before it stopped)
IronWorker endpoint for Prometheus
IronWorker has an API endpoint that returns the data in Prometheus exposition format:
https://worker-aws-us-east-1.iron.io/2/projects/YOUR_PROJECT_ID/codes/YOUR_CODE_ID/metrics
In the above endpoint, YOUR_PROJECT_ID and YOUR_CODE_ID should be replaced with actual values. It returns the number of tasks in each of seven possible task statuses for the specified worker (by your code_id): queued, running, preparing, error, timeout, canceled, complete.
Configure Prometheus to run locally
Running Prometheus in Docker is very simple, especially for people who are familiar with Docker. First, we need to add the IronWorker endpoint to its configuration file (prometheus.yml):
global:
  scrape_interval: 15s # Set the scrape interval to every 15 seconds. Default is every 1 minute.
  evaluation_interval: 15s # Evaluate rules every 15 seconds. The default is every 1 minute.
# Alertmanager configuration
alerting:
  alertmanagers:
    - static_configs:
        - targets:
rule_files:

# Here it's Prometheus itself.
scrape_configs:
  - job_name: "prometheus"
    static_configs:
      - targets: ["worker-aws-us-east-1.iron.io"]
    metrics_path: "/2/projects/YOUR_PROJECT_ID/codes/YOUR_CODE_ID/metrics"
    params:
      oauth: ['YOUR_TOKEN']
Now we are ready to launch the Prometheus service locally and mount the above file to a docker container:
docker run --rm -it -p 9090:9090 -v /path/to/prometheus.yml:/etc/prometheus/prometheus.yml prom/prometheus
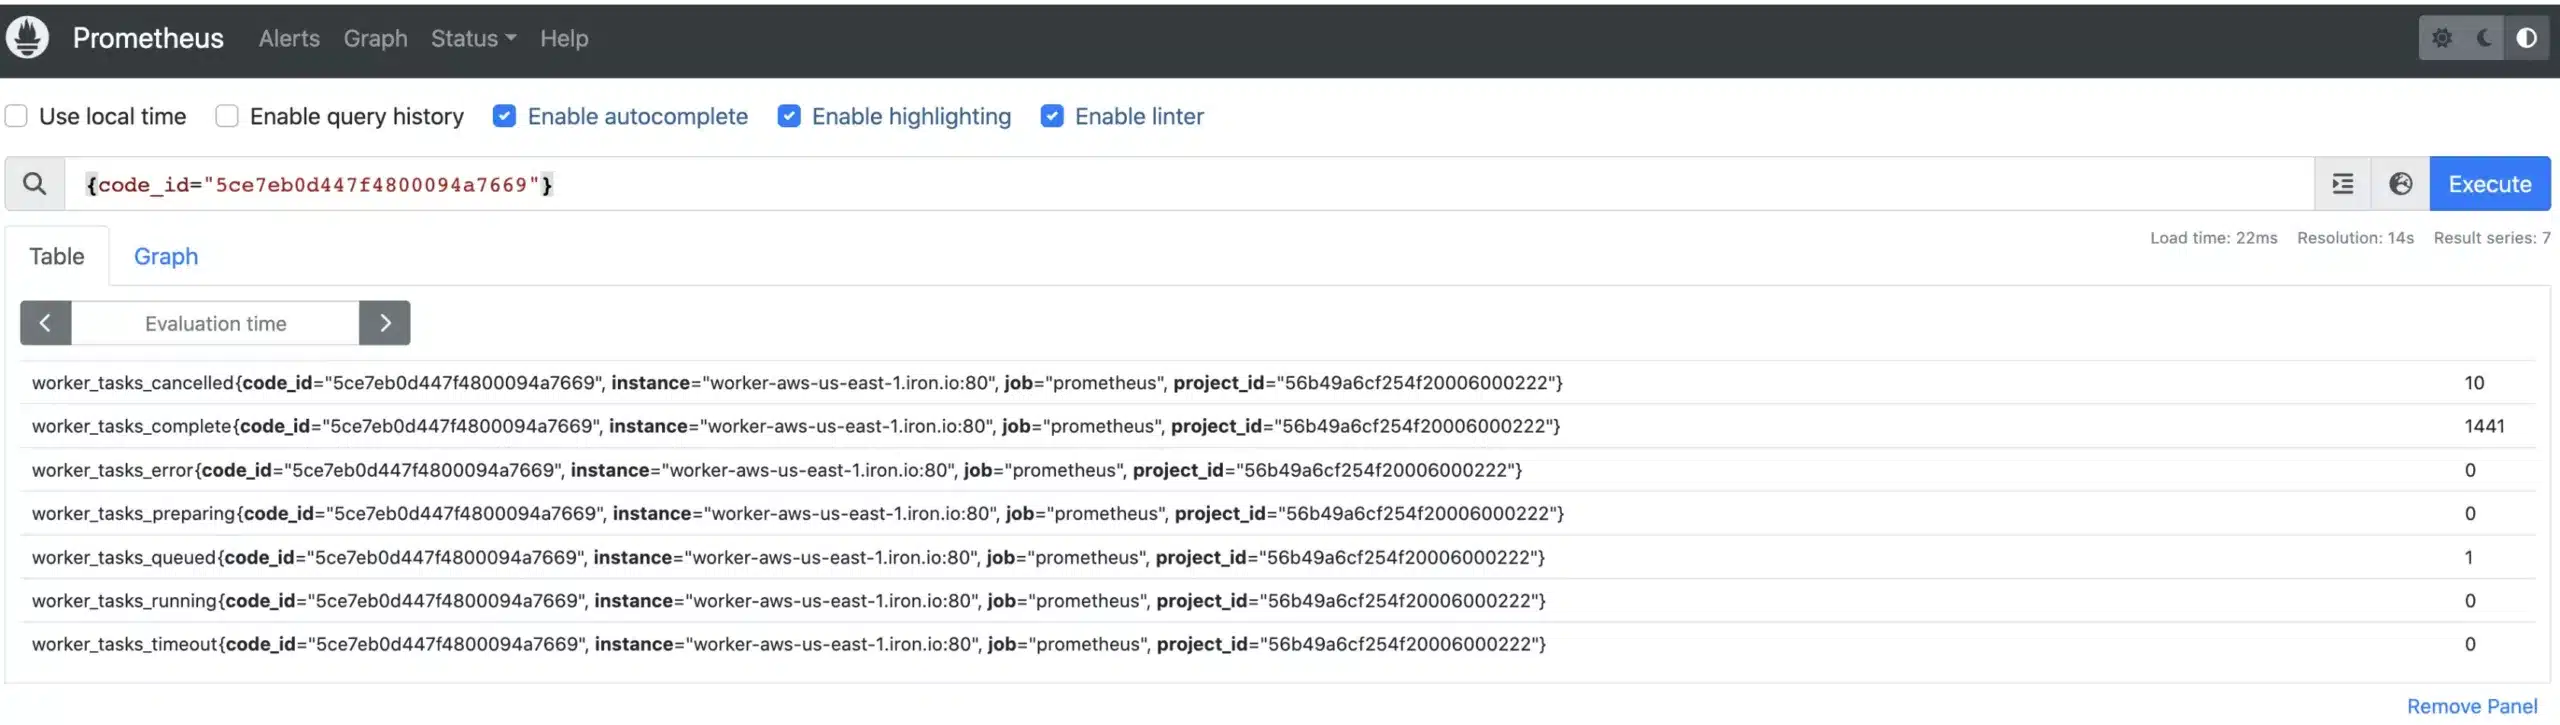
Navigate to localhost:9090 URL in your browser. You will be able to access the following metrics:
- worker_tasks_queued
- worker_tasks_running
- worker_tasks_cancelled
- worker_tasks_complete
- worker_tasks_error
- worker_tasks_preparing
- worker_tasks_timeout
Two custom labels come with the above metrics: project_id, code_id, i.e. it's possible to filter by them.
You can configure the alerts depending on the number of failed IronWorker tasks, i.e. if the number of failed tasks reaches a threshold value - the alert can be triggered. Also, you can configure an alert when you’re experiencing processing delay, during peak times for example. This can be achieved by specifying a threshold value for “worker_tasks_queued” metric.
Finally, you may use tools like Grafana to visualize the metrics collected by Prometheus for a comprehensive view of your task performance.
Conclusion
The Prometheus integration with IronWorker is a game-changer. It offers developers deep insights and helps spot potential issues before they escalate. This is more than just a feature—it's a step forward in making application development easier and more efficient. We discussed the steps to integrate Prometheus with IronWorker and thereby monitor the IronWorker metrics. Try out IronWorker's Prometheus integration today and experience the difference yourself.
For setup guidance, reach out to our team at support@iron.io.
Related reading: How to Boost IronWorker Monitoring with New Relic?